Figure 4
Unilateral retinitis pigmentosa: Case report and review of the literature
Denise Goodwin*, Amanda M Olsen and Karl Citek
Published: 22 August, 2019 | Volume 3 - Issue 2 | Pages: 013-19
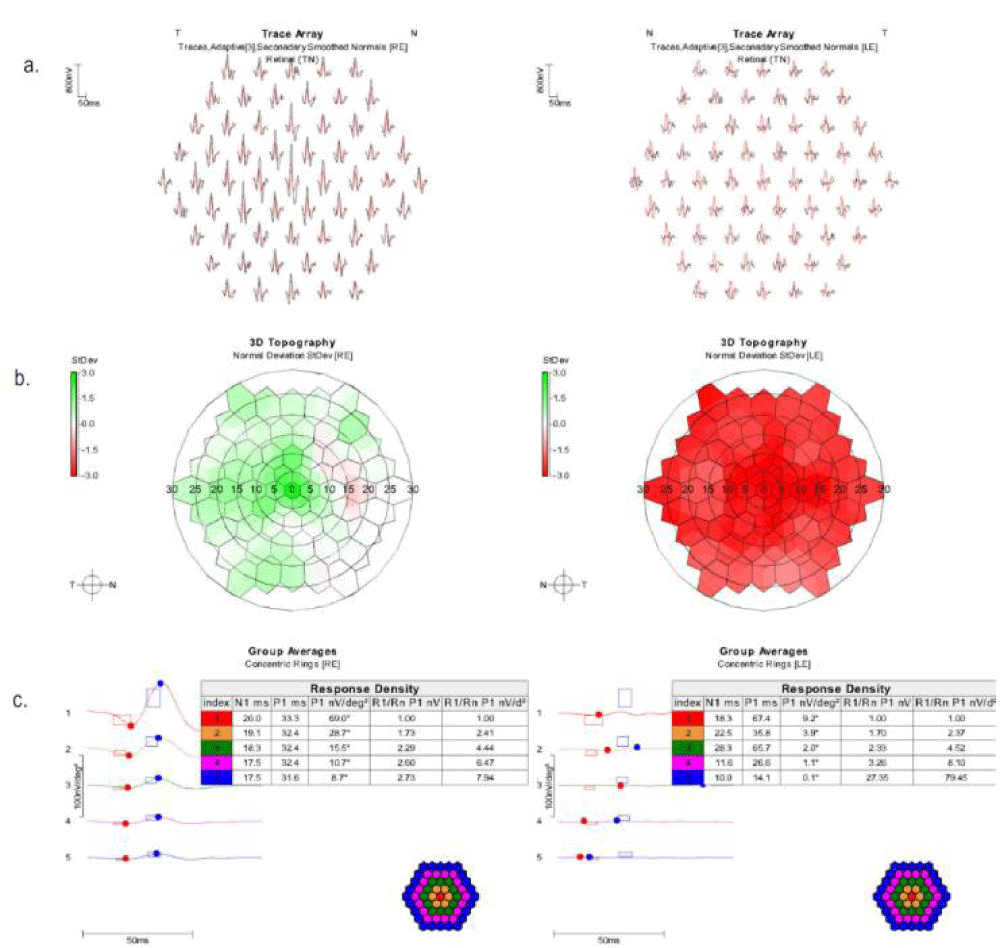
Figure 4:
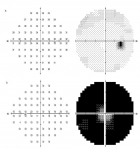
Multifocal electroretinography trace array (a), standard deviation map (b), and group averages (c). Normal trace array values are in red, and patient values are in black. Topography values in red are below average. Those in green are above average.
Read Full Article HTML DOI: 10.29328/journal.ijceo.1001021 Cite this Article Read Full Article PDF
More Images
Similar Articles
-
Detection of Ganglion Cell Loss in Preperimetric Glaucoma by Fourier-Domain Optical Coherence TomographySuneeta Dubey*, Baswati Prasanth,Lokesh Chauhan, Saptarshi Mukherjee. Detection of Ganglion Cell Loss in Preperimetric Glaucoma by Fourier-Domain Optical Coherence Tomography. . 2017 doi: 10.29328/journal.hceo.1001006; 1: 042-048
-
Intravitreal ranibizumab in the management of acute central serous ChorioretinopathyIbrahim Nawaiseh,Ahmad Halawa*,Dina Alardah. Intravitreal ranibizumab in the management of acute central serous Chorioretinopathy . . 2017 doi: 10.29328/journal.hceo.1001007; 1: 049-054
-
The management of Irvine-Gass Syndrome in a patient using Inhaler SteroidAyse Gul Kocak Altintas*,Cagri Ilhan,Mehmet Citirik. The management of Irvine-Gass Syndrome in a patient using Inhaler Steroid . . 2018 doi: 10.29328/journal.ijceo.1001011; 2: 001-005
-
Treatment of Retinal Pigment Epithelial DetachmentAyse Gul Kocak Altintas*,Cagri Ilhan. Treatment of Retinal Pigment Epithelial Detachment . . 2018 doi: 10.29328/journal.ijceo.1001013; 2: 008-014
-
Low vision due to persistent Cloquet’s canalAyse Gul Kocak Altintas*. Low vision due to persistent Cloquet’s canal . . 2018 doi: 10.29328/journal.ijceo.1001014; 2: 015-017
-
Wound architectural analysis of 1.8mm microincision cataract surgery using spectral domain OCTBenedito Antônio de Sousa, Anderson Teixeira*,Camila Salaroli,Nonato Souza,Lucy Gomes. Wound architectural analysis of 1.8mm microincision cataract surgery using spectral domain OCT. . 2019 doi: 10.29328/journal.ijceo.1001020; 3: 008-012
-
Unilateral retinitis pigmentosa: Case report and review of the literatureDenise Goodwin*,Amanda M Olsen,Karl Citek. Unilateral retinitis pigmentosa: Case report and review of the literature. . 2019 doi: 10.29328/journal.ijceo.1001021; 3: 013-19
-
Evaluation of the efficacy of transcorneal electric stimulation therapy in retinitis pigmentosa patients with electrophysiological and structural testsMualla Sahin Hamurcu*,Sema Akkan Aydogmuş,M. Sinan SARICAOĞLU. Evaluation of the efficacy of transcorneal electric stimulation therapy in retinitis pigmentosa patients with electrophysiological and structural tests. . 2020 doi: 10.29328/journal.ijceo.1001030; 4: 031-037
-
Can we predict Alzheimer’s Disease through the eye lens?Sandeep CS*,Vijayakumar N, Sukesh Kumar A. Can we predict Alzheimer’s Disease through the eye lens?. . 2020 doi: 10.29328/journal.ijceo.1001031; 4: 038-040
-
Clinical evaluation of the eye-to-visual-pathway integrity of glaucomatous neurodegeneration using 1.5T MR imaging: The integrity of glaucomatous neurodegenerationKaya N Engin*,Ulviye Yiğit#,Sibel Töreyen Bayramoğlu#,Nurten Turan Güner#,Onur Özyurt#,Kutlay Tufan#,Ahmet Ağaçhan#,Penbe Çağatay#. Clinical evaluation of the eye-to-visual-pathway integrity of glaucomatous neurodegeneration using 1.5T MR imaging: The integrity of glaucomatous neurodegeneration. . 2022 doi: 10.29328/journal.ijceo.1001042; 6: 001-006
Recently Viewed
-
Potential Use of Essential Oils and Their Individual Components in Cosmeceuticals: A ReviewHamdy A Shaaban*. Potential Use of Essential Oils and Their Individual Components in Cosmeceuticals: A Review. Ann Biomed Sci Eng. 2023: doi: 10.29328/journal.abse.1001023; 7: 031-037
-
Studies on some spices and herbs: Chemical composition, health benefits and functional propertiesHamdy A Shaaban*. Studies on some spices and herbs: Chemical composition, health benefits and functional properties. Ann Biomed Sci Eng. 2023: doi: 10.29328/journal.abse.1001019; 7: 001-011
-
About Efficiency of High-order Harmonic Generation in Attosecond PhysicsAng-Yang Yu*. About Efficiency of High-order Harmonic Generation in Attosecond Physics. Int J Clin Virol. 2024: doi: 10.29328/journal.ijcv.1001061; 8: 045-047
-
Success, Survival and Prognostic Factors in Implant Prosthesis: Experimental StudyEpifania Ettore*, Pietrantonio Maria, Christian Nunziata, Ausiello Pietro. Success, Survival and Prognostic Factors in Implant Prosthesis: Experimental Study. J Oral Health Craniofac Sci. 2023: doi: 10.29328/journal.johcs.1001045; 8: 024-028
-
Agriculture High-Quality Development and NutritionZhongsheng Guo*. Agriculture High-Quality Development and Nutrition. Arch Food Nutr Sci. 2024: doi: 10.29328/journal.afns.1001060; 8: 038-040
Most Viewed
-
Evaluation of Biostimulants Based on Recovered Protein Hydrolysates from Animal By-products as Plant Growth EnhancersH Pérez-Aguilar*, M Lacruz-Asaro, F Arán-Ais. Evaluation of Biostimulants Based on Recovered Protein Hydrolysates from Animal By-products as Plant Growth Enhancers. J Plant Sci Phytopathol. 2023 doi: 10.29328/journal.jpsp.1001104; 7: 042-047
-
Sinonasal Myxoma Extending into the Orbit in a 4-Year Old: A Case PresentationJulian A Purrinos*, Ramzi Younis. Sinonasal Myxoma Extending into the Orbit in a 4-Year Old: A Case Presentation. Arch Case Rep. 2024 doi: 10.29328/journal.acr.1001099; 8: 075-077
-
Feasibility study of magnetic sensing for detecting single-neuron action potentialsDenis Tonini,Kai Wu,Renata Saha,Jian-Ping Wang*. Feasibility study of magnetic sensing for detecting single-neuron action potentials. Ann Biomed Sci Eng. 2022 doi: 10.29328/journal.abse.1001018; 6: 019-029
-
Pediatric Dysgerminoma: Unveiling a Rare Ovarian TumorFaten Limaiem*, Khalil Saffar, Ahmed Halouani. Pediatric Dysgerminoma: Unveiling a Rare Ovarian Tumor. Arch Case Rep. 2024 doi: 10.29328/journal.acr.1001087; 8: 010-013
-
Physical activity can change the physiological and psychological circumstances during COVID-19 pandemic: A narrative reviewKhashayar Maroufi*. Physical activity can change the physiological and psychological circumstances during COVID-19 pandemic: A narrative review. J Sports Med Ther. 2021 doi: 10.29328/journal.jsmt.1001051; 6: 001-007

HSPI: We're glad you're here. Please click "create a new Query" if you are a new visitor to our website and need further information from us.
If you are already a member of our network and need to keep track of any developments regarding a question you have already submitted, click "take me to my Query."


